Thursday, February 28, 2013
Bankers getting a larger piece of the pie
This article shows data about banker compensation increases over the last 25 years. Interesting that the article is in Bloomberg whose largest customer segment must be bankers. No doubt in my mind that capital-reallocators have secured a larger piece of the pie. The author shows the trend and despite the title does not delve in to why it has happened. So I will.
Bloomberg: the-reason-wall-street-got-so-rich-in-two-charts
Bankers have been able to extract increasing compensation by:
- combining commercial and investment banking activities which was enabled by the repeal of Glass-Steagall in 1999.
- putting less of their own and getting more of investors money to put at risk. The decline of the partnership ownership structure being replaced by shareholders
- changes to political campaign finance rules that have allowed individuals and corporations to give more and more to specific candidates
- more bankers entering government and more government officials leaving for banking positions
- more and more friends of the CEO on the board of directors
Greg Smith who famously publicly resigned from Goldman Sachs last year because he was discouraged by how the firm kept misleading its clients gave an interesting talk at Stanford recently. The video is here:
Greg Smith former Goldman Sachs Director presentation at Stanford
He did a nice job summarizing how an effective system cannot be regulated with fines, taxes, and the threat of jail time. The system must be structured so that unfair practices are not possible. Commercial banking should be separated from investment banking and not just by a 'Chinese' wall. Traders should have more of their own capital at risk. High frequency trading should be stopped with a procedural change such as a 30 second rule.
Mexico's Federal Auditor Recommends physical audit of gold holdings
Now Mexico is proceeding to join the 'gold rush'. That is the rush to audit their physical gold holdings and move it back to sovereign soil. Over the last several months many countries have officially and publicly stated their intent to audit their gold holdings. Germany recently decided to move all of their gold located in Paris and some of their gold in London and New York back to Germany. And, Venezuela recently moved their gold from London back to sovereign ground.
Mexico currently stores about 95% of its gold abroad and 99% of that in London. Why does Mexico keep over 120 tons of gold in London? London is the home of the London Bullion Exchange where precious metals are traded. I doubt that Mexico is considering selling. So, the only reason I see is that Mexico is so corrupt that they do not trust each other to safe guard their own gold! But, if they are really that corrupt storing it abroad does not really help. The gold can always be transferred to other accounts while abroad. Maybe that is what has already happened. Mexicans get your gold, if it has not already suffered the same fate as that land north of the Rio Grands! Germany is already in line ahead of you!
Mexico wants to audit its gold holdings abroad
Can you imagine how the average US citizen would react if their country's gold was stored abroad? And, even if Mexico keeps their gold abroad would it not be prudent to conduct regular physical audits? Why are the central banks so reluctant to insist on physically auditing their gold?
If London or any other bullion vault does not have all the physical gold that its depositors own they will be forced to cash settle for any shortfall if there is a run on their vaults. And, you can bet that the cash settlement will be based on the market price ($/ounce) from before the run. So the bank nor the depositor will not be able to buy all the missing physical metal on the market because prices for physical will jump as soon as the run starts.
There is precedent in the US, even: cash settling for an amount set before a run is very similar to what US President Roosevelt did in the 1930's when the US dollar was removed from a gold standard. Also, central bank stone-walling physical audit efforts is not just a foreign affair. Representative Ron Paul has been trying unsuccessfully for many years to audit US holdings at Fort Knox and the US Fed Reserve.
Tuesday, February 26, 2013
Miners estimate 2.3% gold production growth in 2013
A survey of 7 top gold mining companies shows expectations of 2.3% growth in gold production for 2013. The mining companies recently reported 2012 actual results and presented estimates for 2013.

The gold mining industry appears to be able to grow production by only 2.3%. And, the cost of producing all ounces of gold is trending up by over 20%.
As a gold bull it is reassuring to see gold supply so limited. 235,000 ounces of the estimated growth is due to strikes at AngloGold mines in South Africa during 2012.
Calculating gold production for each company on comparable basis is difficult. Some publish estimates for gold sales and some for production. Some report sales and production of gold equivalent ounces (GEO) which includes silver production converted to GEO at a price ratio. The ratio is typically about 50:1. In addition the production data may be attributed or managed production. Attributed includes only ounces that are owned by the company. For example, if Mine Co is responsible for managing a mine of which they own 60%, the attributed production would be 60% of the mines total or manged production. In this way the table above could be double counting the production of a specific mine that is jointly owned. These differences do not have a material impact to the trend because they affect 2012 and 2013 similarly.
Reporting of production costs is even more diverse than production. Each miner has their own definition of production cost, cash cost, sustaining cash cost, etc. Estimated total production cost as defined by each company weighted for their respective production increases 20% in 2013.
Monday, February 25, 2013
They are not making it any more!
According to the World Gold Council the supply of gold in 2012 was 4,453.3 tonnes which was 1.4% less than in 2011. The decline is attributed to lower recycling. It seems that the we-buy-gold stores on every other corner are seeing less business.
World Gold Council - demand and supply in 2012
The declining gold supply also shows that mining companies have not been increasing output. As gold and silver prices have increased over the last 5-10 years, mining companies increased investment and more of their reserves became profitable. One would expect these investments and newly profitable reserves to create growth in supply. Mining is a long investment cycle business. Are the investments going to pay off with higher production in the coming years? Are old reserves being depleted as quickly as new reserves are being added?
The old adage about land being a good investment because "they ain't making it any more" may be more apropos for gold and silver. I recently drove across much of Texas and New Mexico and saw a lot of land available.
More from the Kinross Corporation's 2012 MD&A
Gold Supply and Demand Fundamentals
Source: GFMS Gold Survey 2012
Total gold supply decreased a modest 0.7% in 2012 relative to 2011, with global gold mine production increasing 0.2% and recycled gold decreasing 1.6%. Mine production and recycled gold have been the dominant sources of gold supply, and in 2012 they represented approximately 63% and 37% of total supply, respectively.
http://www.kinross.com/media/243788/2012%20mda.pdf
Gold prices down another 2% make for buying opportunity
Spot gold closed last Friday at $1,581 down another $30 or about 2% from February 15th. Month to date gold is down about 6%. As you can see in the chart of historical spot gold prices below, each time that gold prices dipped below $1,600/ounce was a buying opportunity. I am going to invest more in gold and silver. "You call this a storm! It's time for a showdown!" Lieutenant Dan from the movie Forest Gump.
![gold Technical chart [Kitco Inc.]](http://www.kitco.com/lfgif/au0730lf_ma.gif)
![Silver Technical chart [Kitco Inc.]](http://www.kitco.com/lfgif/ag0730lf_ma.gif)
Wednesday, February 20, 2013
Gold and Silver prices are being manipulated down
Why do I believe that gold and silver prices are being manipulated down? Because there are large sell orders placed in the market all at once and at inopportune times. No seller trying to maximize their proceeds would place such large orders all at once because it drives down the price they realize. So why are and who is placing large sell orders? I can think of only one reason: to suppress the price.
Some links to discussion about large sell orders of precious metals:
http://news.sharpspixley.com/article/ross-norman-flash-crash-in-gold-whodunnit-/145195/
http://www.resourceinvestor.com/2013/02/15/the-untold-reality-of-gold-and-silver-price-contro?ref=hp
http://harveyorgan.blogspot.com/
Interestingly gold lease rates recently turned from negative to positive for 3 month leases. If lease rates are negative the lessor will pay you to lease. You could lease gold, sell it, earn interest on the proceeds until the end of the lease term, then buy back the gold from the market, return it to the lessor, and collect the lease payment. In the process you earn the interest and the lease payment. Of course this would only be profitable if you can buy the gold back at a price near where you sold it.
http://www.kitco.com/lease.chart.html
The quoted and publicized prices are for 'paper' gold. Paper refers to a price for a gold contract and not physical gold. The contract can be an option or a forward, for example. In general the contract specifies that the owner can receive the value of gold and not necessarily physical gold bullion. Markets trade contracts instead of the physical commodity for convenience. Traders could not move metal in an out of their vaults as quickly as the amount they buy and sell in a day.
Tuesday, February 19, 2013
Senator Elizabeth Warren attended her fist banking committee hearing a couple days ago and took the SEC to task for not being tough enough with Wall Street. Good for her! Someone is finally doing something to clean up the financial system. I am not even going to mention her political party affiliation for fear of distracting from the main issue: reforming the financial system.
Senator Elizabeth Warren's first banking committee hearing. "Too big to fail has become too big for trial"
You may remember that after the financial crisis and bank bailout in 2007/2008, Warren set up and was Obama's nominee to head the Consumer Financial Protection Bureau. Her nomination was not confirmed after intense lobbying efforts by the big banks. In November she successfully ran for United States Senator for Massachusetts.
The number one, first priority for my great country is to reform the financial system and break the big banks and corporations hold on the government. Senator Warren is the only senator or congressperson who at least appears to be stepping up as a reformer. We need to show her and other politicians that they can stand up to the big money interests, that voters will not be diluted by divisive social and hot-button issues. Financial reformers will be re-elected until, as Jesse writes "the banks have been restrained, and the financial system reformed, with balance restored to the economy."
You can contact Senator Warren with word of encouragement here:
http://www.warren.senate.gov/about.cfm
Monday, February 18, 2013
How to best invest in gold and silver
Currently, I am very bullish on gold and silver for my growth portfolio.
- Bullion in an allocated account. Several companies provide precious metals storage and even trading services. 'Allocate' is the key word here. It means that your bullion is specifically allocated to you and not mixed with that of others. Serial numbers and separate storage areas
are necessary.
- Bullion trusts or closed end funds. A trust will state clearly that all the metals in the trust are stored separately and that it is unencumbered, meaning that no contracts (e.g. leases) have been written to potentially commit this bullion to another party.
- Shares of precious metals exchange traded funds (ETF).
- Options on the price of gold, such as those offered by the CME/COMEX
- Shares of gold mining companies
- Shares of funds of gold mining companies
- Options on the shares of gold mining companies
Do your homework. Make sure you know all the risks of your preferred investment vehicles. You are probably investing in precious metals because you think there's an upcoming crisis. Discovering the risks of your investment during the crisis is an expensive way to learn. Don't look to see if you have flood insurance after the radar map shows a hurricane coming to your doorstep.
I will discuss the advantages and disadvantages of these investment vehicles in future posts. And welcome your comments and emails on the topic.
There are many ways to invest in gold and silver: some better than others.
- Physical bullion: coins or bars and take physical delivery. There are many bullion dealers advertising on the internet now days and they will mail you bullion as quickly as your payment clears.
- Store under your mattress
- Store in a safe deposit box
- Bullion in an allocated account. Several companies provide precious metals storage and even trading services. 'Allocate' is the key word here. It means that your bullion is specifically allocated to you and not mixed with that of others. Serial numbers and separate storage areas
are necessary.
- Bullion trusts or closed end funds. A trust will state clearly that all the metals in the trust are stored separately and that it is unencumbered, meaning that no contracts (e.g. leases) have been written to potentially commit this bullion to another party.
- Shares of precious metals exchange traded funds (ETF).
- Options on the price of gold, such as those offered by the CME/COMEX
- Shares of gold mining companies
- Shares of funds of gold mining companies
- Options on the shares of gold mining companies
Do your homework. Make sure you know all the risks of your preferred investment vehicles. You are probably investing in precious metals because you think there's an upcoming crisis. Discovering the risks of your investment during the crisis is an expensive way to learn. Don't look to see if you have flood insurance after the radar map shows a hurricane coming to your doorstep.
I will discuss the advantages and disadvantages of these investment vehicles in future posts. And welcome your comments and emails on the topic.
How to double your money investing in blue chip stocks
You can easily double your money investing in low-risk blue chip stocks if you can borrow at the same rate as the big banks. This is a quick numerical example of how leverage improves return on equity. This dynamic is currently driving up the S&P500.
The example: start with $35M in equity and borrow $1.0B from a big bank or your central bank (e.g. the US Federal Reserve). Invest your total capital of $1,035M in Cheveron (CVX) stock which paid a dividend of $3.51/share in 2012. Borrow the $1.0B at a pre-tax interest rate equal to the current LIBOR rate for 1 year of 0.82%. The LIBOR rate is the rate that big banks charge each other for loaning money. The big banks are currently able to borrow from their central banks for even less. 12 months LIBOR has been below 1.00% for most months since the end of 2009. But, let's go with 0.82%.
http://www.fedprimerate.com/libor/libor_rates_history.htm
Now sit back for a year and collect $3.51 per share of dividends. Then sell the Chevron shares and pay off the $1.0B loan with the proceeds. If you are lucky the shares may appreciate 4.3% in that year and you earn $44M on top of your $35M investment (scenario A). If the share price is flat for the year you earn only $15M (scenario B). As long as the shares don't lose more than 3.2% in price you win (scenario C).
 Purchasing the $1.0B in shares will help drive up the price of the shares at least in the short term. But, you need the share price to be up a year later when its time to sell. Hopefully, you are early to the game and can count on others to make their initial investments when you want to sell.
This pyramid scheme is fueled by increasingly more dollars to be invested and an ever lower cost (interest rate) of those dollars. Interest rates could increase. It is difficult to imagine rates going any lower. There could be fewer dollars to invest for 2 likely reasons. First, allowable leverage ratios could be reduced. The example used a 30:1 debt to equity ratio, which is common in hedge funds today. Second, banks might lose the ability to borrow. There could be a crisis in confidence where no banks wants to lend.
The current stock market valuation is being propped up by low interest rates, high leverage ratios, and high confidence. At least one of these dynamics is going to give out soon and take the others, and valuations (in real terms) along with it. Valuations denominated in US Dollars may hold up. In order to achieve that the Fed will need to print more and more dollars which devalues the currency. So the S&P500 is likely to keep going up in USD (with some volatile quarters). But the value of the S&P in terms of solid currencies such as gold, silver and oil will decline.
Today the S&P is at $1,519 and will buy 0.95 ounces of gold and 16 barrels of oil.
The example: start with $35M in equity and borrow $1.0B from a big bank or your central bank (e.g. the US Federal Reserve). Invest your total capital of $1,035M in Cheveron (CVX) stock which paid a dividend of $3.51/share in 2012. Borrow the $1.0B at a pre-tax interest rate equal to the current LIBOR rate for 1 year of 0.82%. The LIBOR rate is the rate that big banks charge each other for loaning money. The big banks are currently able to borrow from their central banks for even less. 12 months LIBOR has been below 1.00% for most months since the end of 2009. But, let's go with 0.82%.
http://www.fedprimerate.com/libor/libor_rates_history.htm
Now sit back for a year and collect $3.51 per share of dividends. Then sell the Chevron shares and pay off the $1.0B loan with the proceeds. If you are lucky the shares may appreciate 4.3% in that year and you earn $44M on top of your $35M investment (scenario A). If the share price is flat for the year you earn only $15M (scenario B). As long as the shares don't lose more than 3.2% in price you win (scenario C).
This pyramid scheme is fueled by increasingly more dollars to be invested and an ever lower cost (interest rate) of those dollars. Interest rates could increase. It is difficult to imagine rates going any lower. There could be fewer dollars to invest for 2 likely reasons. First, allowable leverage ratios could be reduced. The example used a 30:1 debt to equity ratio, which is common in hedge funds today. Second, banks might lose the ability to borrow. There could be a crisis in confidence where no banks wants to lend.
The current stock market valuation is being propped up by low interest rates, high leverage ratios, and high confidence. At least one of these dynamics is going to give out soon and take the others, and valuations (in real terms) along with it. Valuations denominated in US Dollars may hold up. In order to achieve that the Fed will need to print more and more dollars which devalues the currency. So the S&P500 is likely to keep going up in USD (with some volatile quarters). But the value of the S&P in terms of solid currencies such as gold, silver and oil will decline.
Today the S&P is at $1,519 and will buy 0.95 ounces of gold and 16 barrels of oil.
Gold and Silver down 3.2% and 5.3% in February Month to Date
Gold and Silver spot prices are down significantly so far in February.
| Market Price at Close | |||||||
| Gold | Silver | ||||||
| XAU-USD | Change$ | Change% | XAG-USD | Change$ | Change% | ||
| 12/31/2012 | $1,675.35 | $30.3500 | |||||
| 1/31/2013 | $1,663.70 | -$11.65 | -0.7% | $31.4600 | $1.11 | 3.7% | |
| 2/15/2013 | $1,610.15 | -$53.55 | -3.2% | $29.7975 | -$1.66 | -5.3% | |
| Year to Date: | -$65.20 | -3.9% | -$0.55 | -1.8% | |||
http://www.bloomberg.com/quote/XAUUSD:CUR
As a precious metals bull, this volatility is tough to stomach. But, I've been through worse before. Any investor in precious metals can look at the price chart for the last 3 years and see that they are in for.
I am fully bought in to the theories that gold and silver prices are being managed down by the bullion banks and the world's central banks. They are managing prices to increase slowly over the years. Their hold on the market, especially the derivatives market will eventually slip and prices for physical gold and silver will jump. Currently market prices in the news are from the derivatives market. One might reasonable expect prices to drop just before the market for physical gold and silver dislocates from the paper or derivatives market.
What exactly is the XAU-USD that Bloomberg and most other news agencies seem to report as the spot price for gold? I think it is a contract linked to the market prices of gold as determined by the CME each day. Trading in gold on the CME offers contracts that are backed by the option of physical gold delivery only on several specific days during the year. Since the XAU-USD is a spot rate in order to be back by physical gold it requires the option of physical delivery on every trading day. Daily physical delivery is not available or possible so XAU-USD cannot be backed by physical gold. Buyer's of XAU accept counter-party risk knowing that the counter party has no physical gold allocated to that contract and would therefore settle with dollars . . . if they can.
Friday, February 15, 2013
Japan breaking ranks from G-20 in race to bottom
The other 19 countries in the G-20 are upset that Japan has devalued their currency faster than they. All the countries are manipulating their currencies for devaluation. They are trying to do it in an orderly, concerted way to reduce the risk of shock to the global financial system. While everyone is proceeding to the exits in an orderly fashion, the sight of one person sprinting would create panic.
http://www.bloomberg.com/news/2013-02-14/g-20-head-russia-pushes-for-currency-manipulation-stance.html
If all the countries devalue their currencies together 1) none will gain an 'unfair' advantage in the export market 2) the loans to another country will not lose value. For example if the Yen devalues 15% versus all other currencies, Japanese exports are that much lower cost to importers which give Japan an 'unfair' advantage. And those countries that made loans to Japan (denominated in Yen) would lose 15% because the Yen that is used to pay back the loans would be worth 15% less than the Yen that Japan borrowed. This is a hypothetical example because I think that Japan is actually in a net creditor position. Japan has loaned out more than it has borrowed from other countries. So think of Spain, or Italy, or France instead of Japan. If Italy devalued the Lira all the German, US and Chinese banks that loaned Italy money would realize huge losses. Yes, Italy is part of the Euro now and the Lira does not exist anymore which complicates the situation. However until recently, the countries of the Euro were not obligated to cover each others debts even though the debts were all denominated in Euros.
Countries are devaluing their currencies because they are bankrupt and there are two ways out. The first way is to declare bankruptcy and pay all your creditors 60 cents on the dollar or whatever you can afford. Iceland did this a couple years ago. Countries often do this by issuing a new currency. The second is to devalue the currency so that the value required to pay their debts is less. An example: the country of Bennistan borrows 100 Bens from its citizens to finance a war and bail out its banks. Bennistan agrees to pay back the debt in 30 years. At the time a 100 Bens will purchase 100 barrels of oil and 10 ounces of gold in the global market. 15 years later it is clear that Bennistan will not be able to pay back these 100 Bens when they are due. Over those first 15 years Bennistan continued to borrow more and more money. Now Bennistan decides to create or print 100 new Bens and use these to pay off the debt coming due. The global market sees the Bens are worth less than before because there are now more Bens for the same Bennistan economy. So the rest of the world demands more Bens for their exports. A 100 Bens will now buy only 50 barrels of oil and 5 ounces of gold in the global market. The citizens of Bennistan get paid back the Bens that they loaned their country, but by the time they get their money back it is worth less. It has less purchasing power.
It takes only 4% inflation to lower purchasing power by 50% in 10 years. Many of the citizens of Bennistan do not realize that they have indeed loaned their country a lot of money. They have not purchased Bennistan treasury bills. They have agreed to be paid their retirement benefits (social security and medical) many years after earning it, which is in all practicality the same as loaning their country the cost of these benefits.
Today in the USA we've seen oil and gold costs in US dollars increase dramatically over the last 10 years. Retail prices for gas are up from about $1.50 per gallon to over $3.50 today. Gold bullion is up from about $350 per ounce to over $1,600 today. Interestingly, gold and oil prices have been pretty flat over the last 2 years.
G-20 Seeks Common Ground on Currencies After Yen Split
http://www.bloomberg.com/news/2013-02-14/g-20-head-russia-pushes-for-currency-manipulation-stance.html
If all the countries devalue their currencies together 1) none will gain an 'unfair' advantage in the export market 2) the loans to another country will not lose value. For example if the Yen devalues 15% versus all other currencies, Japanese exports are that much lower cost to importers which give Japan an 'unfair' advantage. And those countries that made loans to Japan (denominated in Yen) would lose 15% because the Yen that is used to pay back the loans would be worth 15% less than the Yen that Japan borrowed. This is a hypothetical example because I think that Japan is actually in a net creditor position. Japan has loaned out more than it has borrowed from other countries. So think of Spain, or Italy, or France instead of Japan. If Italy devalued the Lira all the German, US and Chinese banks that loaned Italy money would realize huge losses. Yes, Italy is part of the Euro now and the Lira does not exist anymore which complicates the situation. However until recently, the countries of the Euro were not obligated to cover each others debts even though the debts were all denominated in Euros.
Countries are devaluing their currencies because they are bankrupt and there are two ways out. The first way is to declare bankruptcy and pay all your creditors 60 cents on the dollar or whatever you can afford. Iceland did this a couple years ago. Countries often do this by issuing a new currency. The second is to devalue the currency so that the value required to pay their debts is less. An example: the country of Bennistan borrows 100 Bens from its citizens to finance a war and bail out its banks. Bennistan agrees to pay back the debt in 30 years. At the time a 100 Bens will purchase 100 barrels of oil and 10 ounces of gold in the global market. 15 years later it is clear that Bennistan will not be able to pay back these 100 Bens when they are due. Over those first 15 years Bennistan continued to borrow more and more money. Now Bennistan decides to create or print 100 new Bens and use these to pay off the debt coming due. The global market sees the Bens are worth less than before because there are now more Bens for the same Bennistan economy. So the rest of the world demands more Bens for their exports. A 100 Bens will now buy only 50 barrels of oil and 5 ounces of gold in the global market. The citizens of Bennistan get paid back the Bens that they loaned their country, but by the time they get their money back it is worth less. It has less purchasing power.
It takes only 4% inflation to lower purchasing power by 50% in 10 years. Many of the citizens of Bennistan do not realize that they have indeed loaned their country a lot of money. They have not purchased Bennistan treasury bills. They have agreed to be paid their retirement benefits (social security and medical) many years after earning it, which is in all practicality the same as loaning their country the cost of these benefits.
Today in the USA we've seen oil and gold costs in US dollars increase dramatically over the last 10 years. Retail prices for gas are up from about $1.50 per gallon to over $3.50 today. Gold bullion is up from about $350 per ounce to over $1,600 today. Interestingly, gold and oil prices have been pretty flat over the last 2 years.
At the pump: Gas Prices on the Rise
Confirming what you probably already felt the last time you filled your cars tank: Average retail price in US for all grades all formulations was $3.68/gallon on February 11th
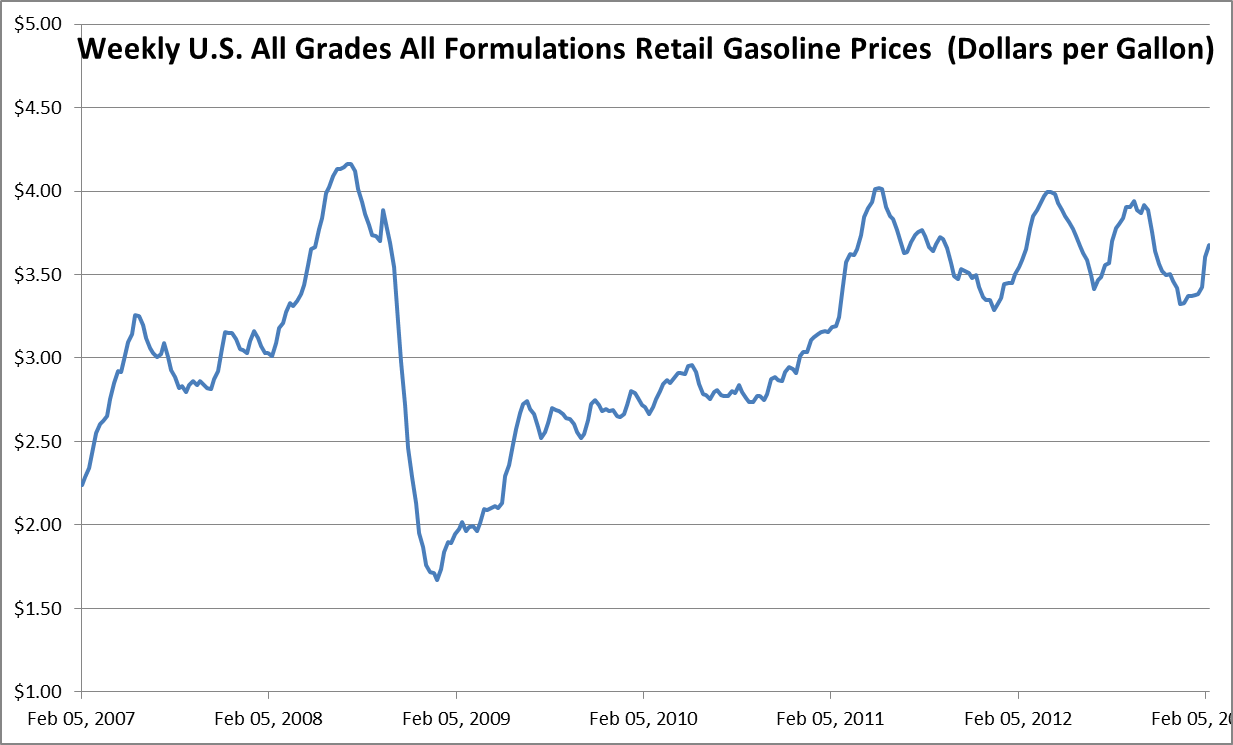
Interestingly diesel prices have been flat at about $4.00 per gallon for the last 2+ years.

The US government's Energy Information Agency provides very nice data and charting tools for energy prices:
http://www.eia.gov/dnav/pet/hist/LeafHandler.ashx?n=pet&s=emd_epd2dxl0_pte_nus_dpg&f=w
Interestingly diesel prices have been flat at about $4.00 per gallon for the last 2+ years.
The US government's Energy Information Agency provides very nice data and charting tools for energy prices:
http://www.eia.gov/dnav/pet/hist/LeafHandler.ashx?n=pet&s=emd_epd2dxl0_pte_nus_dpg&f=w
Thursday, February 14, 2013
HSBC the Gangsters Bankers - too big to jail or fine
This was a new low when I read about the US Dept. of Justice settlement with HSBC at the end of last year. HSBC blatantly ignored international banking laws and laundered money used to finance drug lords and terrorists. And, no one is held responsible for fear of disrupting the banking system. Taibbi does a good, entertaining job of telling the story.
HSBC the Gangster Bankers - Matt Taibbi
There must have been many, many people at the bank complicit in the money laundering. How can they live with themselves knowing that they aided such violent criminals. Maybe the bonus money bought them enough liquor, luxury cars, and vacations to suppress their memories.
And to the US DoJ, its about time that you consider the disruption to the banking system if you do not prosecute and punish these types of actions. For how many people was this the last straw of evidence of a corrupt financial system. The last straw that shattered their confidence and inspired them to act, if only to remove their precious savings from the financial-political pyramid scheme.
Rik Green's growth portfolio up 2.2% in January
Rik Green's growth portfolio <Port-faux-lio> gained 2.2% in January and the S&P500 was up 4.8%. CVX outpaced the S&P500 and was up 6%. The precious metals funds were up 2% offset by a 4% decline in GG. The gold mining sector continues to suffer from throwing good money after gold that costs more than $1,600/ounce to get out of the ground. Market valuations for strong gold mining companies are going to take off once the market sorts out the herd. CVX ended January at $115.15 per share close to its high last September of $118.53. At $115 per share the dividend yield on CVX is just over 2.3%, which makes it attractive if you can lever up 99 to 1 with zero interest money. More on that later.
Wednesday, February 13, 2013
How JPMorgan lost over $4B: EXCEL'ing at finding the desired result
You may remember back in mid-2012 JP Morgan's CIO office reported over $4B of trading losses. From JP Morgan's Q2 earning release:
JP Morgan recently published a report regarding how such a well managed and closely audited organization could lose so much money so quickly. Thanks to Zerohedge who brought the report to my attention! Zerohedge focused on the report's finding of an EXCEL formula error. There are more gems in the report that inspire comment and show exactly how much you can trust JP Morgan to know the right thing and to do the right thing, even with its own money.
Read Zerohedge's comments here: http://www.zerohedge.com/news/2013-02-12/how-rookie-excel-error-led-jpmorgan-misreport-its-var-years
The CIO is JPMorgan's Chief Investment Office which manages the banks money. Here's how the task force report describes the CIO:
Managing JPMorgan's money is a big job. They don't just park it in T-Bills or index funds. They seek higher returns which leads them to riskier investments. A concept called VaR (Value at Risk) is a statistical metric to measure and manage investment risk. Banks employ 'modelers' to create these metrics and apply them to specific investments such as Synthetic Credit Obligations (CDOs).
For traders, the lower the VaR on their investments the better, because then the trader can put more money at risk. If VaR gets too high senior management may not allow a trader to continue adding to their position for fear of putting too much money at risk.
From the task force's report:
The VaR metric is based on volatility. The inputs to the VaR model were less volatile than in reality. So the VaR model yielded a lower VaR. These are smart people working at JPMorgan. They knew exactly how much confidence to put in this VaR model.
Report of JPMorgan Chase & Co. Management Task Force
Regarding 2012 CIO Losses January 16, 2013 http://files.shareholder.com/downloads/ONE/2272984969x0x628656/4cb574a0-0bf5-4728-9582-625e4519b5ab/Task_Force_Report.pdf
Second-quarter results included the following significant items:
$4.4 billion pretax loss ($0.69 per share after-tax reduction in earnings) from CIO trading losses and $1.0 billion pretax benefit ($0.16 per share after-tax increase in earnings) from securities gains in CIO's investment securities portfolio in Corporate. "JP Morgan Second Quarter 2012 Earning Release July 13, 2012"It turns out that JPMorgan lost $4B with the ubiquitous 'garbage in: garbage out' and a lack of controls. One might reasonably expect more when so many experts and dollars are involved! We can all learn from JPMorgan's mistakes: learn to be skeptical of statistical models; learn how the desired result is accepted without question; learn how easily contradictory evidence is discarded; learn how bright individuals with short term incentives need close supervision.
JP Morgan recently published a report regarding how such a well managed and closely audited organization could lose so much money so quickly. Thanks to Zerohedge who brought the report to my attention! Zerohedge focused on the report's finding of an EXCEL formula error. There are more gems in the report that inspire comment and show exactly how much you can trust JP Morgan to know the right thing and to do the right thing, even with its own money.
Read Zerohedge's comments here: http://www.zerohedge.com/news/2013-02-12/how-rookie-excel-error-led-jpmorgan-misreport-its-var-years
The CIO is JPMorgan's Chief Investment Office which manages the banks money. Here's how the task force report describes the CIO:
JPMorgan’s businesses take in more in deposits than they make in loans and, as a result, the Firm has excess cash that must be invested to meet future liquidity needs and provide a reasonable return. The primary responsibility of CIO, working with JPMorgan’s Treasury, is to manage this excess cash. CIO is part of the Corporate sector at JPMorgan and, as of December 31, 2011, it had 428 employees, consisting of 140 traders and 288 middle and back office 22 employees. page 21
Managing JPMorgan's money is a big job. They don't just park it in T-Bills or index funds. They seek higher returns which leads them to riskier investments. A concept called VaR (Value at Risk) is a statistical metric to measure and manage investment risk. Banks employ 'modelers' to create these metrics and apply them to specific investments such as Synthetic Credit Obligations (CDOs).
For traders, the lower the VaR on their investments the better, because then the trader can put more money at risk. If VaR gets too high senior management may not allow a trader to continue adding to their position for fear of putting too much money at risk.
From the task force's report:
From February to April, the new VaR model was in operation. A CIO employee who reported to the modeler was responsible for daily data entry and operation of the new model. In April, an employee from the IT Department (who had previous experience as a senior quantitative developer) also began to provide assistance with these tasks. Notwithstanding this additional assistance, a spreadsheet error caused the VaR for April 10 to fail to reflect the day’s $400 million loss in the Synthetic Credit Portfolio. This error was noticed, first by personnel in the Investment Bank, 126 and by the modeler and CIO Market Risk, and was corrected promptly. Because it was viewed as a one-off error, it did not trigger further inquiry. page 127Why was it viewed as a one-off error? What gave them the confidence that the 'error' would not occur again? And, even if it was a one-off it should have triggered further inquiry and investigation. Clearly, they simply did not want to believe that the new VaR model could be wrong, because it gave the traders a better answer. And note that the CIO employee using the model reported to the creator of the model. What would happen if/when that employee found a mistake in the model?
. . . . further errors were discovered in the Basel II.5 model, including, most significantly, an operational error in the calculation of the relative changes in hazard rates and correlation estimates. Specifically, after subtracting the old rate from the new rate, the spreadsheet divided by their sum instead of their average, as the modeler had intended. This error likely had the effect of muting volatility by a factor of two and of lowering the VaR, although it is unclear by exactly what amount, particularly given that it is unclear whether this error was present in the VaR calculation for every instrument, and that it would have been offset to some extent by correlation changes. It also remains unclear when this error was introduced in the calculation. page 128Shit happens. Mistakes are made. Why wasn't this mistake caught before going in to production? This kind of 'honest' mistake can be made in any software or back of an envelope. Year ago I completed a financial valuation of an acquisition target for my company. My wise boss then had me analyze and present all of my assumptions and results (e.g. EBITDA, IRR, NPV, EPS) compared to those provided by our investment bankers. And then he insisted on understanding exactly why the bankers' result were different or similar to those of my own analysis.
Mr. Weiland and another member of CIO Market Risk contacted the Model Review Group regularly in the last two weeks of January to inquire into the progress of the model approval and, in a January 23, 2012 e-mail to the modeler, the trader to whom the modeler reported wrote that he should “keep the pressure on our friends in Model Validation and [Quantitative Research].” There is some evidence the Model Review Group accelerated its review as a result of this pressure, and in so doing it may have been more willing to overlook the operational flaws apparent during the approval process. page 125The modeler who is responsible for creating the metric by which the trader should be controlled reports to the trader. And JPMorgan is Sar-Box compliant!
In addition, many of the tranches were less liquid, and therefore, the same price was given for those tranches on multiple consecutive days, leading the model to convey a lack of volatility. While there was some effort to map less liquid instruments to more liquid ones (i.e., calculate price changes in the less liquid instruments derived from price changes in more liquid ones), this effort was not organized or consistent page 124
The VaR metric is based on volatility. The inputs to the VaR model were less volatile than in reality. So the VaR model yielded a lower VaR. These are smart people working at JPMorgan. They knew exactly how much confidence to put in this VaR model.
Report of JPMorgan Chase & Co. Management Task Force
Regarding 2012 CIO Losses January 16, 2013 http://files.shareholder.com/downloads/ONE/2272984969x0x628656/4cb574a0-0bf5-4728-9582-625e4519b5ab/Task_Force_Report.pdf
Sunday, February 10, 2013
Subscribe to:
Posts (Atom)