Showing posts with label Silver. Show all posts

Sunday, May 4, 2014

US Mint Coin Sales YTD: Gold Weaker and Silver Stronger

Sales of gold Eagle and Buffalo coins by the US Mint have been very slow this year.  Year to date sales are down 58% from 2013 and 7% from 2012.  Gold coin sales in April 2013 we exceptional.  Sales have not been this slow since 2008.  Is demand weak or supply constrained?  Sales have been increasing each month since January.  


Silver Eagle sales on the other hand have been very strong.  Year to date sales of 18.5 million coins are 1% more than in 2013 and a record.  2014 sales were off to a slow start in January because 2014 silver Eagles were released in smaller allotments over a longer time than in previous years.


Thursday, January 2, 2014

GLD Inventory of Gold Drops Below 800 Tonnes, a five year low, when Gold was less than $1,000/ounce

I finally found some time to look at GLD and SLV exchange traded plans (ETP) inventory and price history.

Gold inventory at GLD fell to just below 800 tonnes in the last days of December 2013.  The last time GLD has 800 or fewer tonnes of gold was in December 2008 when the price of gold was $780 per ounce.  In 2008, the gold bull market was strengthening which eventually pushed prices over $1,800.  2013 is the reverse.  Gold buyers are so bearish that they wish to own only 800 tonnes even with the price at $1,200.

Remember only Authorized Participants (AP) in GLD, such as HSBC, Goldman, JP Morgan, Scotia, Deutsche, Citi, and UBS are allowed to create or redeem baskets of 100,000 GLD shares in exchange for bullion.  The Trust is responsible to manage inventory so that the price of GLD shares tracks that of gold.


Interestingly, silver inventory at the SLV Trust has remained flat while price dropped during the last year.  It seems that silver bears are not as pessimistics as gold bears.  There are many other possible causes of the disparate behavior of GLD and SLV inventory.  What's your theory?


Thursday, December 5, 2013

US Mint Gold Coin Sales Steady in November. Silver Eagle Sales Drop.

Sales of gold Eagle and Buffalo coins by the US Mint were 62,000 ounces in November, compared to 66,500 in October and 23,000 in September.  November gold sales were 60% less than in November last year which was an exceptional month.  As of November, year to date gold sales are 1,032,500 ounces which is 29% more than in 2012 and 5% less than in 2011.  The US Mint reported November sales of 14,000 gold Buffalo coins and 48,000 ounces of gold Eagle coins.


Sales of silver Eagles by the US Mint were 2,300,000 in November, compared to 3,087,000 ounces in October.  November sales were by far the lowest month of this year.  Sales in November were 27% less than in November 2012.  Year to date silver Eagle sales are a record 41,475,000 ounces which is 29% more than 2012 and 10% more than in 2011.  The Mint has sold the most silver Eagles in 2013 than in any recent year.


The US Mint reduced the retail price for an uncirculated Gold Eagle from $1,625 to $1,525 during November.  And, the US Mint's website currently (Dec 5th) states that uncirculated gold Eagles are sold out.  An uncirculated silver Eagle retails for $43.95 which is unchanged from July, August, September, and October.

A quick survey of 3 internet coin dealers currently shows premiums of about $4.00 for silver Eagles.  Unlike last month the coin dealers are now quoting prices that are very close to each other.  The premium for gold Eagles is about $60, which is slightly less than last month.  These price premiums are based on purchasing one coin.  All dealers offer volume discounts for larger purchases.  Spot gold and silver market prices are currently $1,233 and $19.70, respectively.

Coin dealers are currently offering to pay about $20.00 and $1.90 over spot to purchase gold and silver Eagles, respectively.  This seems reasonable because the US Mint charges dealers 3% for gold and $2.00 per coin for silver.  Dealer purchase premiums are not hinting at supply constraints as they were in April and May.

Monday, November 4, 2013

US Mint Sales of Gold Coins Recovered in October. Silver Sales Steady.

Sales of gold Eagle and Buffalo coins by the US Mint were 66,500 ounces in October, compared to 23,000 in September and 21,500 in August.  October gold sales were 5% less than in October last year.  As of October, year to date gold sales are 970,500 ounces which is 50% more than in 2012 and 7% less than in 2011.  The US Mint reported October sales of 18,000 gold Buffalo coins and 48,500 ounces of gold Eagle coins.

Sales of silver Eagles by the US Mint were 3,087,000 in October, compared to 3,013,000 ounces in September.  October sales were slightly higher than September which was the lowest month of this year.  Sales in October were 2% less than in October 2012.  Year to date silver Eagle sales are a record 39,175,000 ounces which is 39% more than 2012 and 7% more than in 2011.  Silver is on track for a record year.


source: http://www.usmint.gov/about_the_mint/index.cfm?action=PreciousMetals&type=bullion

The US Mint maintained the retail price for an uncirculated Gold Eagle at $1,625 during October.  An uncirculated silver Eagle retails for $43.95 which is unchanged from July, August, and September.

A quick survey of 3 internet coin dealers currently shows premiums of about $3.00 to $4.50 for silver Eagles.  This is a wide spread.  Dealer prices are usually closer.   The premium for gold Eagles is about $65.  The premium for gold and silver Eagles is about the same as last month.  These price premiums are based on purchasing one coin.  All dealers offer volume discounts for larger purchases.  Spot gold and silver market prices are currently $1,320 and $21.84, respectively.


Coin dealers are currently offering to pay about $25 and $1.75 over spot to purchase gold and silver Eagles, respectively.  This seems reasonable because the US Mint charges dealers 3% for gold and $2.00 per coin for silver.  Dealer purchase premiums are not hinting at supply constraints as they were in April and May.


Monday, October 7, 2013

COMEX Gold has 48 Owners per Ounce, Jesse

Analysis of open interest and warehouse inventory on the COMEX for gold and silver: http://jessescrossroadscafe.blogspot.com/2013/10/owners-per-ounce-of-silver-and-gold-at.html

Conclusion:
Each ounce of registered silver in COMEX inventory has 13 owners.
Each ounce of registered gold in COMEX inventory has 48 owners.

Background:
The COMEX has entered contracts with various buyer and sellers of gold and silver.  In summary these contracts exchange metal at a future date for cash now.  The total of all ounces that are under contract is called 'open interest.'  If all contract holders were to demand physical deliver or settlement when their contract expires, the COMEX would currently need 48 times as much physical gold to avoid a delivery default.  This would be similar to a run on a bank.  Banks do not have all their depositors cash on hand.  And, if all depositors insisted on withdrawing their cash at the same time the bank would be caught short.

As you can see from the charts in Jesse's post, historically the COMEX has kept only a fraction of physical metal in inventory to support multiples of contracts.  Currently gold's ratio of 48 is extremely high.

Contract holders typically settle for cash because they do not want to store the physical metal and they probably need cash to pay margin debt that they took on to invest in COMEX contracts in the first place.  With 48 owners per ounce, if more than 2.1% of contract holders stand for physical delivery the COMEX will delivery default.

In a delivery default the COMEX can force the contract holder to accept cash for settlement.   It is not clear what price per ounce would be used to cash settle.  http://rikgreeninvestorforum.blogspot.com/2013/10/comex-contracts-allow-for-forced-cash.html   A delivery default would likely send the price of physical gold sky-rocketing.  I suspect that the COMEX would cash settle at a pre-lift-off price.

Friday, October 4, 2013

COMEX Contracts Allow for Forced Cash Settlement

According to David Morgan in this interview by usawatchdog.com precious metals forward contracts allow for the COMEX to force cash settlement.  Therefore, if the COMEX runs out of physical metal it will not technically default.  The discussion of a potential COMEX default begins at minute 14:30 in this video interview.  


There is no reasons to doubt Morgan's read of COMEX contracts.  I like his attitude, "read the contract."  I would like to.  Can anyone refer me to a copy of COMEX precious metals contracts?

This raises the big question of why anyone would use the COMEX to trade in precious metals if there are situations where you could be stuck with fiat currency instead of bullion.  The current price of paper gold must be discounted for this risk.  Amazingly one can still purchase physical from coin dealers for example for near paper gold prices.  The discount can be this small only because every COMEX trader thinks they will be able to get out before there's a run on the vault.

Run you fools . . . 

Thursday, October 3, 2013

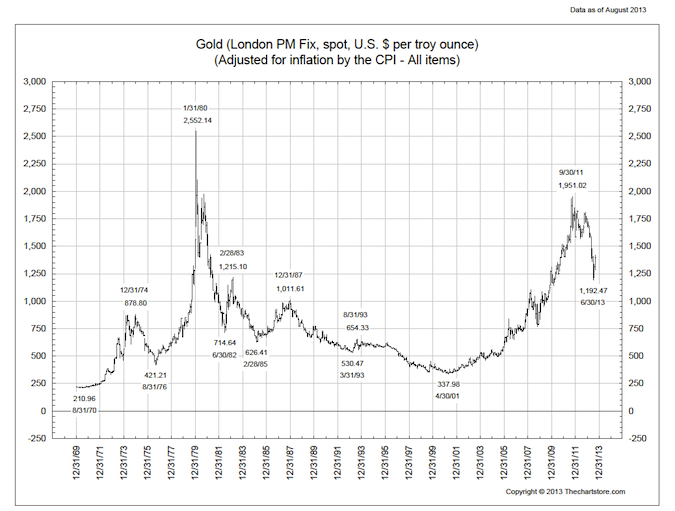
Historical Gold Prices Show Volatility - Don't get left behind!


This link is to a good commentary by Michael Kosares at usagold.com 
http://www.usagold.com/publications/octreview2013.html

It is reassuring to know that gold prices have not increased as quickly nor as much as as the NASDAQ in the 90's and gold in the 1970's and oil in the 2000's.  These comparisons do not however prove that gold is not currently in a bubble.  History repeats itself, but maybe the current situation is different.  When was the last time the world reserve currency was dramatically debased while alternative currencies were not available (e.g. the Chinese Yuan) or in worse shape (e.g. Euro and Yen)?  When was the last time that gold prices were set based on a contract to deliver gold and not physical?  The extent of price manipulation in the precious metals markets makes historical comparisons dangerous.  

The chart of historical gold prices adjusted for CPI is a good reminder.  For a gold bull, the historical volatility in gold prices is remarkable.  And, volatility in recent years must be compounded by the advent of derivatives and ETP trading.  Reading from the chart gold jumped from $1,000 to $2,500 in about 3 months back in 1979.  When gold jumps it really takes off.  Don't get left behind.  

Wednesday, October 2, 2013

US Mint Sales of Gold Coins slow in September. Silver sales decelerating.

Sales of gold Eagle and Buffalo coins by the US Mint were 23,000 ounces in September, compared to 21,500 in August and 69,000 in July.  September gold sales were 7% more than in August, which was the lowest month since June 2008.  As of September, year to date gold sales are 904,000 ounces which is 56% more than in 2012 and significantly less than in 2009, 2010, and 2011.  The US Mint reported September sales of 10,000 gold Buffalo coins and 13,000 ounces of gold Eagle coins.

Sales of silver Eagles by the US Mint were 3,013,000 in September, compared to 3,625,000 ounces in August.  September sales were the lowest month of this year and 7% less than in September 2012.  Year to date silver Eagle sales are a record 36,088,000 ounces which is 40% more than 2012 and significantly more than in earlier years.  

http://www.usmint.gov/about_the_mint/index.cfm?action=PreciousMetals&type=bullion

The US Mint decreased the retail price for an uncirculated Gold Eagle by $50 to $1,625 during September.  An uncirculated silver Eagle retails for $43.95 which is unchanged from July and August.

A quick survey of 3 internet coin dealers shows that pricing for gold and silver Eagles is about $65 and $3.00 over spot respectively.  The premium for gold Eagles is the same as last month while the premium for silver Eagles has decreased about $1.00.  These price premiums are based on purchasing one coin.  All dealers offer volume discounts for larger purchases.  Spot gold and silver market prices are currently $1,318 and $21.88, respectively.


Coin dealers are currently offering to pay about $25 and $1.75 over spot to purchase gold and silver Eagles, respectively.  This seems reasonable because the US Mint charges dealers 3% for gold and $2.00 per coin for silver premiums.  Dealer purchase premiums are not hinting at supply constraints as they were in April and May.

Coin sales by the Austrian and Australian mints have followed the same trend as US Mint sales.
http://www.bloomberg.com/news/2013-08-28/austrian-mint-increases-gold-sales-as-price-slump-spurs-demand.html
http://www.bloomberg.com/news/2013-07-04/gold-sales-slump-at-australia-s-perth-mint-as-rout-deters-buyers.html

Wednesday, September 4, 2013

US Mint Sales of Gold Coins Tanked in August. Sales of Silver Eagles Remained Strong.

Sales of gold Eagle and Buffalo coins by the US Mint were 21,500 ounces in August, compared to 69,000 ounces in July and 48,000 ounces in August 2012.  August gold sales were the lowest month since June 2008.  As of August, year to date gold sales are 881,000 ounces which is 76% more than in 2012 and 1% more than in 2011.  The US Mint reported that in August 10,000 gold Buffalo coins and 11,500 ounces of gold Eagle coins were sold.

Sales of silver Eagles by the US Mint were 3,625,000 in August, compared to 4,406,500 ounces in July.  Silver sales are still strong despite the drop from July's exceptional performance.  August silver Eagle sales were 26% more than in August 2012.  And, sales in August exceeded sales in May and in June.  
Year to date silver Eagle sales are a record 33,075,000 ounces which is 47% more than 2012.  Silver sales are well on track for a record year.


http://www.usmint.gov/about_the_mint/index.cfm?action=PreciousMetals&type=bullion


The US Mint increased the retail price for an uncirculated Gold Eagle by $50 to $1,675 during August.  An uncirculated silver Eagle retails for $43.95 which is unchanged from July.

A quick survey of 3 internet coin dealers shows that pricing for gold and silver Eagles is about $65 and $4.00 over spot respectively.  The premium for gold Eagles decreased slightly and for silver has increased over the last month.  These price premiums are based on purchasing one coin.  The dealers all offer volume discounts for larger purchases.  Spot gold and silver market prices are currently $1,392 and $23.40, respectively.


Coin dealers are currently offering to pay about $25 and $1.75 over spot to purchase gold and silver Eagles, respectively.  This seems reasonable because the US Mint charges dealers 3% for gold and $2.00 per coin for silver premiums.  Dealer purchase premiums are not hinting at supply constraints as they were in April and May.


Monday, August 26, 2013

Physical Gold News Headlines

Mine workers in South Africa are striking which will reduce supply and increase cost of gold.
http://beforeitsnews.com/financial-markets/2013/08/all-eyes-on-south-africa-2595944.html

Gold jewelry demand in Indonesia is set to hit 40 metric tons this year a 30% increase from 2012.
http://www.bloomberg.com/news/2013-08-22/gold-s-rout-spurs-surge-in-indonesian-demand-southeast-asia.html

The Shanghai Gold exchange continues to trade a tremendous amount of gold bullion.  Lately, weekly trading volumes have been almost as much as annual global gold production.  Also note that price premiums, the difference between prices paid on the Shanghai exchange and international gold prices are about 1.5%.
http://koosjansen.blogspot.nl/2013/08/week-32-sge-chart.html

A good review of recent restrictions on gold imports to India, as well as some history and speculation on what is to come.
http://www.kitco.com/ind/AuthenticMoney/2013-08-21-Is-India-Preparing-To-Confiscate-Its-Citizens-Gold.html

US Mint sales of gold and silver eagles has fallen dramatically in August after a torid pace through July http://www.maxkeiser.com/2013/08/u-s-mint-american-eagles-sales-fall-in-august-but-robust-for-2013/

My attention has been increasing focused on news about physical gold and silver because manipulation of the precious metals markets will be short term as long as demand for physical is strong.  Understanding the bullion funds GLD and SLV is central to understanding the market.  Many pundits proclaimed that when prices were falling in April and May the funds were forced to sell bullion which perpetuated the price decline.  In reality, the GLD and SLV funds do not work that way.  Bullion may only be sold through Authorized Participants (AP) in the fund in baskets of 100,000 shares.  The APs are the bullion banks, including Goldman Sachs, HSBC, and JP Morgan.

These are two excellent articles about the GLD and SLV funds.  I wish I had discovered them sooner.  
http://victorthecleaner.wordpress.com/2012/06/01/gld-the-central-bank-of-the-bullion-banks/
http://fofoa.blogspot.com/2011/01/who-is-draining-gld.html
The authors show graphs of inventory levels and share prices at GLD.  Inventory and price are correlated, but not perfectly which proves to me that share demand does not directly translate to sales or purchases of physical.  The authors conclude that the bullion banks move gold in and out of GLD with share redemptions as they need the physical.  Thus declining inventory at GLD implies that the bullion banks need physical and is bullish for gold.  

Tuesday, June 11, 2013

US Mint Sales of Gold and Silver Coins Slow From April

Sales of gold Eagle and Buffalo coins by the US Mint were 82,500 ounces in May, compared to 246,500 ounces in April and 62,500 ounces in May 2012.  As of May, year to date gold sales are a record 716,500 ounces and up 106% from 2012.

Sales of silver Eagles by the US Mint were 3,458,500 in May, compared to 4,087,000 ounces in April and 2,875,000 in May 2012.  Year to date silver sales are a record 21,768,500 ounces and up 50% from 2012.


Gold and silver sales in May were significantly below April.  Toward the end of April the US Mint announced that they were stocked out of 1/10 ounce gold eagles which is their most popular gold coin.  Also during April and May many internet coin dealers announced shipment delays as they could not quickly replenish their inventory from the US Mint.  This suggests that supply by the US Mint constrained sales in May, while demand remained high.  

The US Mint also seems to have raised prices for direct or retail business.  Currently an uncirculated one ounce gold eagle is $1,725 from the US Mint website.  This is a $345 or 25% premium to the current spot price of about $1,380.  A quick review of 3 internet coin dealer shows that they are currently selling gold eagles for $1,435 or a premium of $55 over spot.  Dealer pricing from the US Mint for one ounce gold eagles is 3% over spot, which is currently $41.  So the dealers are currently asking a $14 per coin margin over their cost.  A couple of months ago I did an analysis that showed dealers were charging a margin of about $30 per 1 ounce gold eagle.

When the US Mint started shipping 1/10 ounce gold eagles again in mid-May I saw several articles about how the pricing showed that physical gold was really valued at $1950 per ounce.  The US Mint price for 1/10 eagles was (and still is) $195 per coin and the spot price of paper gold at the time was below $1,400.  This assertion missed the fact that the 1/10 eagles for sale by the US Mint for $195 are proofs.  I am learning about coin collecting.  Proofs certainly carry a much larger premium over melt value than circulated, and even uncirculated coins.  The internet coin dealers currently have uncirculated 1/10 eagles for sale in the $160 per coin range, while higher quality pressing go for up to $200 per coin.  Already in June the US Mint reports sales of 45,000 1/10 gold eagles, so their pricing is not out of line.

The internet coin dealers are now quoting US eagles for immediate delivery, so they seem to have re-stocked their inventory.  I have not heard of any shipment delays or stock outs from the US mint, so they seem to have caught up with wholesale demand, as well.  The real action is in India, Dubai, and China, where demand seems to still be outstripping supply and historically high premiums to melt continue to be reported.

Wednesday, May 29, 2013

Paper vs Physical Gold Article in Forbes.com with historical wholesale silver premuims to melt

This link is to a short article by Addison Wiggin about paper and physical gold.  It quotes Eric Sprott and John Embry who have been writing about the precious metal markets pyramid schemes for many years.
http://www.forbes.com/sites/greatspeculations/2013/05/28/somebody-is-messing-with-the-gold-market/

This article is significant for two reasons:
1. It is published in Forbes.com that, presumably has a very broad readership.  
2. A chart of wholesale 90% US silver coin premiums to melt value from 1998 to today is included.

The source for the silver premiums is noted on the chart as "CoinExpert.com".  I searched the CoinExpert.com site http://coinexpert.com/US%2090%20PREMIUM.htm and found a chart of the premiums from 1998 to 2010.  The source of this data is not clear.  Perhaps the CoinExpert tracks it independently.  Data like this would be very insightful if it was clear exactly what the data represents and how it is collected.

According to the chart, current wholesale US silver coin premiums are almost 20%, which is very high and has happened only three times since 1998. The previous occurrence of 20%+ premiums was at the end of 2008.  During 2008 the market price of silver rose above $20/ounce and then dropped to almost $10/ounce.  After bottoming out at about $10, silver prices went on a tear to about $50/ounce over the following 2.5 years.  Perhaps today's high premiums portend similar silver price gains in the coming months.

Annual Gold and Silver Production by Country per the US Geological Survey

US Geological Survey statistics for annual world gold and silver production are shown below.  China and Russia are top producers of gold and silver.  Pundits typically ignore gold sourced from China and Russia because their central banks supposedly purchase all domestic production.  That assumption may be true.  But, it is good to know the significance of Chinese and Russian production.  Would they ever lease their gold?  in exchange for Taiwan, perhaps?


Gold
World Mine Production and Reserves: Reserve data for Brazil, Chile, Ghana, and Peru were revised based on
information from the respective country Governments.
Mine Production
2011 2012e Reserves7
United States 234 230 3,000
Australia 258 250 7,400
Brazil 62 56 2,600
Canada 97 102 920
Chile 45 45 3,900
China 362 370 1,900
Ghana 80 89 1,600
Indonesia 96 95 3,000
Mexico 84 87 1,400
Papau New Guinea 66 60 1,200
Peru 164 165 2,200
Russia 200 205 5,000
South Africa 181 170 6,000
Uzbekistan 91 90 1,700
Other countries 640 645 10,000
World total (rounded) 2,660 2,700 52,000
World Resources: An assessment of U.S. gold resources indicated 33,000 tons of gold in identified (15,000 tons)
and undiscovered (18,000 tons) resources.8
Nearly one-quarter of the gold in undiscovered resources was estimated
to be contained in porphyry copper deposits. The gold resources in the United States, however, are only a small
portion of global gold resources.
Source: US Geological Survey: Mineral Commodity Summaries 2013 page 67

SILVER
World silver mine production increased to a new record of 24,000 tons as a result of increased production from mines 
in China, Kazakhstan, and Mexico, as well as increased recoveries from mines in Indonesia and Peru. Production 
also increased in Australia because of the start up of the Wonawinta Mine (lead-zinc) in New South Wales and a 
major expansion for the Mount Isa (copper-lead-zinc), which was processing ore from the newly opened Lady Loretta 
Mine (copper) in Queensland. In 2012, the Sindesar Khurd Mine (lead-zinc) in India was estimated to have produced 
70 tons more of silver than it produced in 2011. Overall, domestic silver production declined, with the temporary 
closure of Lucky Friday Mine, ID, in January 2012, the leading domestic primary silver mine in 2011. The mine was 
ordered closed by the Mine Safety and Health Administration after an accident and rock burst at yearend 2011 that 
led to a buildup of material in the Silver Shaft, the primary access to Lucky Friday. Production was expected to 
resume in early 2013. Output also fell at Bingham Canyon Mine, UT (copper-molybdenum), at the Mission Complex, 
AZ (copper-molybdenum), and at the Midas Mine, NV (gold). Some of the output losses were partially offset by 
production gains at the Rochester Mine (primary silver) and at the Smoky Valley Common Operations (gold), both in 
Nevada.
World Mine Production and Reserves: Reserve data for Chile were revised based on new information from
Government and industry sources.
Mine production 
2011 2012e Reserves
United States 1,120 1,050 25,000
Australia 1,730 1,900 69,000
Bolivia 1,210 1,300 22,000
Canada 572 530 7,000
Chile 1,290 1,130 77,000
China 3,700 3,800 43,000
Mexico 4,150 4,250 37,000
Peru 3,410 3,450 120,000
Poland 1,170 1,170 85,000
Russia 1,350 1,500                               NA
Other Countries 3,600 3,900 50,000
World total (rounded) 23,300 24,000 540,000
Source: US Geological Survey: Mineral Commodity Summaries 2013 page 147

http://minerals.usgs.gov/minerals/pubs/mcs/2013/mcs2013.pdf

Another Fake Bullion story: 1 ounce silver bars sold in Colorado

Fake one ounce silver bars sold in Colorado.
http://www.upnorthlive.com/news/story.aspx?id=893244#.UaZnI7XvuSp

The producer of these bars will certainly keep trying.  Shocking that someone would purchase silver bars without testing of any kind.  It is very easy to weigh, measure, and ping test bars and coins.  Acid testing and specific gravity are straight forward as well.  Caveat emptor.  

And, link to earlier story re: fake silver eagles found by Canadian police:
http://www.youtube.com/watch?v=ljL-AKCeYPU&list=UUSG0X1f3J3hygUPmKmSbsbQ&index=1
Testing for weight exposes these coins as fakes, as well.

Monday, May 20, 2013

Gold and Silver Volatility part II - What a day! Hong Kong Commodity Exchange defaults!

Gold and silver prices were slammed in Asian markets before the COMEX opened.  Prices started the day in the US down but then rallied at the end of the day to end up about 2%.  
Live 24 hours gold chart [Kitco Inc.]


Live 24 hours silver chart [ Kitco Inc. ]


Shares of my mining company investments were up 6-7% for the day.

There were also a couple incredible developments in the precious metals markets:

The CME halted trading last night in the silver market several times amid a flash crash:
http://www.zerohedge.com/news/2013-05-20/silver-halted-4-times-overnight-amid-flash-crash

The Hong Kong Mercantile Exchange defaulted on precious metals contracts and will be settling all existing contracts with cash not bullion.  The HKMEx has stopped trading in all commodity contracts and according to their press release "voluntarily surrender the authorisation to provide automated trading services (“ATS”) granted by the Securities and Futures Commission (“the SFC”)."

The HKMEx press release is here:
http://hkmerc.com/en/Media-Centre/Press-Releases/HKMEx-Voluntarily-Surrenders-Authorisati.xml

The press release is commented on here:
http://sherriequestioningall.blogspot.com/2013/05/hong-kong-mercantile-exchange.html#comment-form

And, Sherrie's comments are endorsed by Harvey Organ here:
http://harveyorgan.blogspot.com/