This link is to a good commentary by Michael Kosares at usagold.com
http://www.usagold.com/publications/octreview2013.html
It is reassuring to know that gold prices have not increased as quickly nor as much as as the NASDAQ in the 90's and gold in the 1970's and oil in the 2000's. These comparisons do not however prove that gold is not currently in a bubble. History repeats itself, but maybe the current situation is different. When was the last time the world reserve currency was dramatically debased while alternative currencies were not available (e.g. the Chinese Yuan) or in worse shape (e.g. Euro and Yen)? When was the last time that gold prices were set based on a contract to deliver gold and not physical? The extent of price manipulation in the precious metals markets makes historical comparisons dangerous.
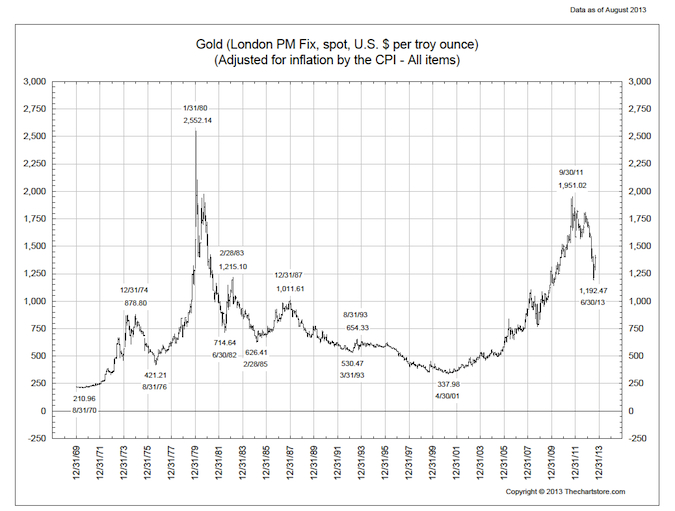
The chart of historical gold prices adjusted for CPI is a good reminder. For a gold bull, the historical volatility in gold prices is remarkable. And, volatility in recent years must be compounded by the advent of derivatives and ETP trading. Reading from the chart gold jumped from $1,000 to $2,500 in about 3 months back in 1979. When gold jumps it really takes off. Don't get left behind.
Gold trading needs live updates and trading calls on commodity market as mentioned in blog like this. Join Epic Research for similar kind of updates and trading calls.
ReplyDelete